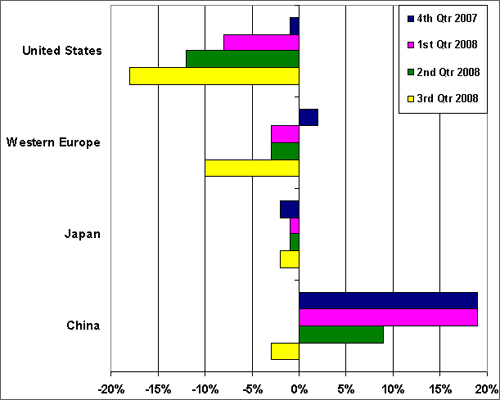
A bilateral graph is a graph that specializes in showing both negative and positive values of measure. These graphs are usually in bar or line form, but can vary. This graph shows the percent growth of automotive sales from the various places. The map shows negative growth for all except for china, which showed tremendous percentage growth in three of the four quarters.
No comments:
Post a Comment